
For most of the past decade, the story of the aftermarket brake-parts business was told as a single trend line: Chinese exports up, Western manufacturing flat, prices under pressure. Customs data show that this story is now too simple. The global trade map for brake components has been redrawn in ways that are visible in the numbers, and the redrawing matters to anyone whose business is built on making or moving those parts.
This article looks at what customs statistics actually show about competition in brake components, why the pattern shifted, and what the shift implies for the structure of the industry rather than for any single buyer's decision.
What the trade data measure, and what they do not
The cleanest publicly available proxy for international competition in this product family is the customs classification HS 870830, "brakes and servo-brakes and parts thereof". The United Nations Comtrade database publishes annual export and import values by reporting country; the values below are annual values in current US dollars, retrieved from the UN Comtrade public data service on 15 November 2026 for the years 2015 through 2025.
Three cautions belong in any honest reading. First, these are values, not volumes: inflation, exchange rates and product mix all move the dollar totals. Second, export values are generally recorded free on board and import values including freight and insurance, so mirror statistics between an exporter and its partner do not match exactly. Third, HS 870830 is a broad heading that includes complete brakes, servo-brakes and parts, so it captures boosters, calipers, master cylinders and pumps only approximately, and it does not separate original-equipment supply from aftermarket supply.
With those limits stated, the direction of travel is not ambiguous.
The seven-exporter picture
Using Comtrade data for seven large reporting exporters, brake-component exports between 2015 and 2024 moved as follows (current US dollars):
- China: from about 4.70 billion to 8.26 billion, up roughly 76 percent.
- Mexico: from about 1.98 billion to 4.58 billion, up roughly 131 percent.
- Germany: from about 4.25 billion to 5.18 billion, up roughly 22 percent.
- Italy: from about 1.86 billion to 2.49 billion, up roughly 34 percent.
- Japan: from about 1.34 billion to 1.60 billion, up roughly 19 percent.
- The United States: from about 2.91 billion to 2.62 billion, down roughly 10 percent.
- Korea: from about 0.96 billion to 0.77 billion, down roughly 20 percent.
Figure 1 plots the same export values for direct visual comparison.
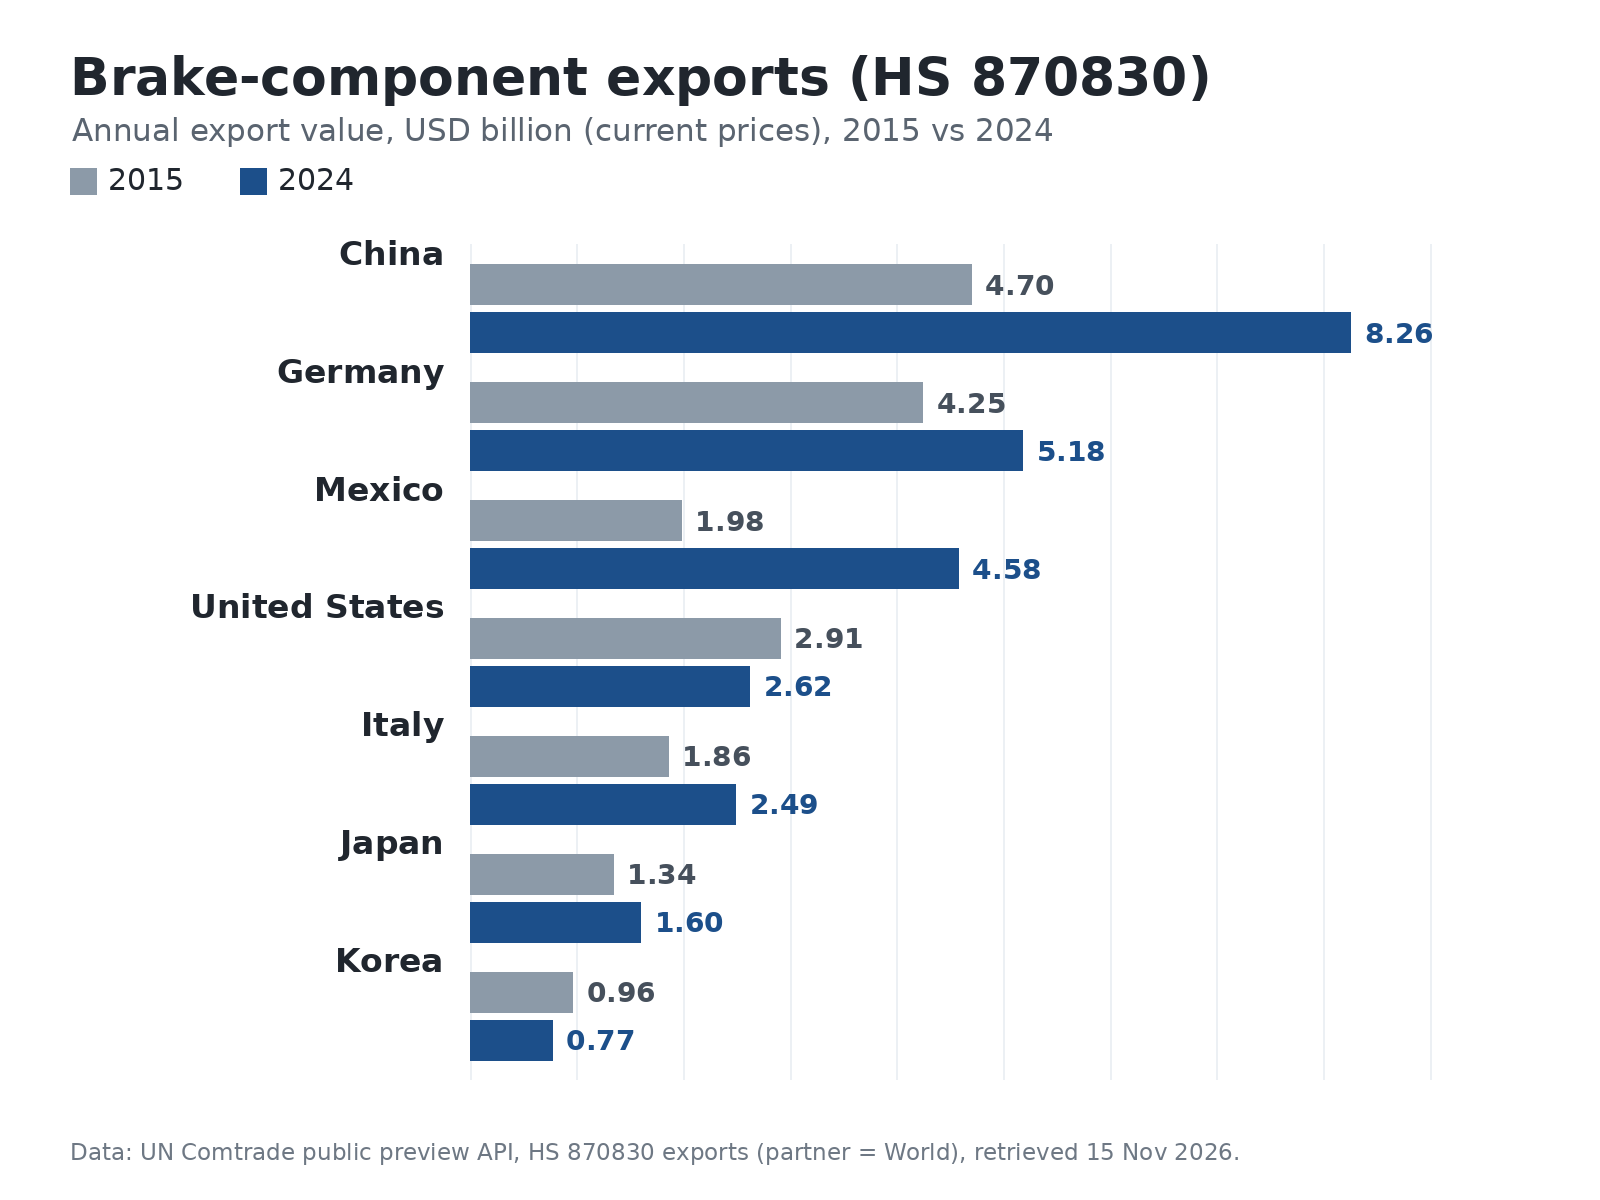
Figure 1. Brake-component exports (HS 870830), 2015 and 2024, in billions of current US dollars. Data: UN Comtrade public preview API (HS 870830, exports, partner = World), retrieved 15 November 2026.
Two observations follow. The first is that China remains the largest single exporter in this group, and its absolute growth has not stopped: the 2025 annual figure reported at the time of retrieval was about 8.12 billion, in line with 2024 rather than collapsing. The second is that the fastest proportional growth came from Mexico, whose brake-parts exports more than doubled in nine years. Germany and Italy held their ground; the United States and Korea lost share of their own export base.
A single number captures the competitive shift more sharply than the aggregate. In 2015, the United States imported about 5.25 billion dollars of HS 870830 products. China supplied about 1.65 billion of that, or roughly 31.5 percent, and Mexico supplied about 1.34 billion, or 25.5 percent. By 2024, total US imports had risen to about 7.45 billion, but China's share had fallen to about 25.0 percent while Mexico's had risen to about 44.4 percent. In the 2025 annual data available at retrieval, Mexico's share reached about 47.4 percent and China's about 21.3 percent.
The mirror statistics add a useful footnote. In 2024, China reported exporting about 2.03 billion dollars of HS 870830 to the United States, while the United States reported importing about 1.86 billion from China. The gap is consistent with the known asymmetries of customs recording, and it does not change the direction of the shift; it is a reminder that trade data are evidence to be interpreted, not a scoreboard.
Why the map moved
The nearshoring interpretation is not speculation. An analysis of US trade data from 2019 to 2023 examined whether the shift from China to Mexico actually occurred after the pandemic disruptions. It found that China's exports waned while Mexico's surged, with Mexico surpassing China in the studied trade relationship by March 2023, and that the pattern extended across sectors such as machinery and electrical components (Stringer & Ramírez-Melgarejo, 2023).
Research on the Mexican automotive industry explains the mechanism. A study of the sector during the pandemic period documented that, as part of the North American supply chain, Mexico attracted growing inward foreign direct investment and nearshoring activity in its northern regions, stabilising supply chains under the USMCA framework and amid US-China tensions (Medina, 2023). Proximity, tariff treatment and lead-time resilience are all part of the explanation; none of them is primarily about the unit price of a brake caliper.
That is the first independent insight the data support: the competitive map is becoming regional as much as global. A brake component is a relatively heavy, relatively low-value-density object. Freight cost per dollar of product is higher than for electronics, and a two-week ocean transit is a real inventory burden for a distributor. When a nearby supplier can deliver in days, the economics of the whole chain, not just the invoice, tilt toward proximity. Mexico's export surge is the measurable result.
The second insight concerns where a Chinese exporter's growth now comes from. China's absolute exports kept rising even as its share of US imports fell. That combination implies growth in other markets rather than retreat: the same nine years that saw China's US share decline also saw its total exports rise by roughly three and a half billion dollars. For an exporter, the strategic question is therefore market mix and product mix, not merely price competition in a single destination.
Competition is now a portfolio contest
The seven-exporter data also show that scale in one product line is not enough to hold position. Germany and Italy, with high-cost manufacturing and strong original-equipment relationships, increased exports modestly. Japan was roughly flat in proportional terms. Korea declined. Mexico doubled.
What separates these trajectories is not only cost. It is the breadth of the catalogue, the depth of the vehicle-parc coverage and the ability to supply the right mix of part numbers to each regional market. Brake systems are not one part: a distributor's demand is spread across boosters, master cylinders, calipers, hoses, pumps and electronic assemblies, each tied to specific vehicle generations. A supplier that covers a wide slice of that catalogue can serve a market with fewer relationships and fewer shipments; a supplier with a narrow range competes on individual part numbers and price.
This is consistent with research on the independent aftermarket, which has argued that performance measurement for independent distributors needs to span the whole spare-parts supply chain, with categories, subcategories and indicators for visibility rather than a single cost metric (Achetoui, Mabrouki & Mousrij, 2022). The firms that grow are the ones whose supply chain is legible and complete, not the ones with the lowest quote on one item.
The currents that will redraw the map again
Trade data describe the recent past. Three technological and regulatory currents are already changing what will be traded in the next decade.
The first is electrification. Regenerative braking recovers energy that friction brakes would otherwise turn into heat, and modelling studies predict that it removes a large share of friction braking. One simulation across vehicle classes and driving styles estimated that regenerative braking systems would reduce brake wear by 64 to 95 percent, with an average reduction in brake-wear particulate emission factors of about 68 percent for electric powertrains in urban driving (Hicks, Green & Beevers, 2023). Measurements on a plug-in hybrid instrumented on mountainous roads found regenerative efficiency of about 64 percent in normal driving but only about 53 percent in aggressive driving, and more than 90 percent of aggressive-mode friction energy occurred beyond the power limit of the regenerative system (Hu et al., 2025). Friction parts will not disappear, but the demand per vehicle-mile for pads and discs is structurally lower in electrified fleets, and the same trend is visible in brake-pad life modelling for regenerative vehicles (Antanaitis & Robere, 2022).
The second is the reorganisation of brake hardware itself. Electro-hydraulic and brake-by-wire architectures combine the booster and pressure-control functions and change which components are serviceable in the field (Zhao et al., 2024). For the trade map, this means the product mix shifts over time from mechanically simple assemblies toward units with sensors, connectors and control electronics, which changes the qualification and documentation burden for exporters.
The third is the regulatory contest over who may service and supply vehicles. Research on access to digital car data argues that real-time maintenance data held by manufacturers can be used to steer drivers toward official dealers, and that the technical gateways proposed for independent operators suffer from portability, switching-cost and scale problems (Martens & Mueller-Langer, 2020). A later legal-economic analysis argues that digital gatekeeping by manufacturers is reinforcing their position in repair and maintenance markets and that the European block-exemption framework has not kept pace with software-defined vehicles (Hey & Zombek, 2026). If service access tightens, the channel through which independent aftermarket parts reach vehicles tightens with it, regardless of where the parts are manufactured.
Electrification also reshapes remanufacturing, a significant part of the independent aftermarket. A study combining theory with industry-expert validation found that the shift from internal-combustion to battery-electric drive trains changes core availability, the economics of remanufacturing and the competences required, creating both challenges and opportunities for remanufacturers (Casper & Sundin, 2020).
What the numbers imply for the industry
Three conclusions follow from the data and the literature, stated as industry outlook rather than as purchasing advice.
First, the trade map is regionalising. Mexico's rise in US imports is the clearest signal, and it is supported by independent research on nearshoring rather than by a single year's data. Suppliers whose growth strategy assumes a single low-cost export corridor are exposed to policy and logistics shifts that are already visible in the statistics.
Second, scale is becoming a portfolio property. The exporters that gained share over the decade were not always the cheapest; they were the ones able to serve a wide, regional catalogue with reliable delivery. In a product family where freight and lead time are material, breadth and proximity are competitive assets in their own right.
Third, the product itself is changing. Regenerative braking reduces friction-brake wear, electro-hydraulic architectures change the serviceable assembly, and the right-to-repair contest determines who can fit what. The next version of this trade map will not be a simple continuation of the last one.
None of this makes the aftermarket smaller in the near term. Vehicle populations are still growing in many markets, and the installed base of internal-combustion vehicles will keep demand for conventional brake assemblies for years. But the composition of that demand, and the geography of who supplies it, are moving. The data are public; reading them carefully is a competitive capability in itself.
Where these parts sit in the catalogue
The assemblies discussed here are listed by part number and vehicle application in our vacuum brake booster, hydraulic brake booster and hydro-boost, brake caliper, brake master cylinder and ABS pump categories, which is where a part number can be matched to an application and compared across suppliers.
References
- Stringer, T., & Ramírez-Melgarejo, M. (2023). Nearshoring to Mexico and US Supply Chain Resilience as a Response to the COVID-19 Pandemic. Findings. https://doi.org/10.32866/001c.91272
- Medina, L. A. (2023). COVID-19 crisis and the automotive industry in Mexico: public policies and firm strategies. International Journal of Automotive Technology and Management, 23(1), 42. https://doi.org/10.1504/ijatm.2023.129636
- Hicks, W., Green, D. C., & Beevers, S. (2023). Quantifying the change of brake wear particulate matter emissions through powertrain electrification in passenger vehicles. Environmental Pollution, 336, 122400. https://doi.org/10.1016/j.envpol.2023.122400
- Hu, R., Zheng, J., Chen, X., Li, L., & Liu, Y. (2025). Driving behavior shapes PHEV brake energy and brake wear particle emissions. Transportation Research Part D: Transport and Environment, 150, 105087. https://doi.org/10.1016/j.trd.2025.105087
- Antanaitis, D., & Robere, M. (2022). Estimating Brake Pad Life in Regenerative Braking Intensive Vehicle Applications. SAE International Journal of Advances and Current Practices in Mobility, 5(4), 1424-1437. https://doi.org/10.4271/2022-01-1161
- Zhao, X., Xiong, L., Zhuo, G., Tian, W., Li, J., Shu, Q., Zhao, X., & Xu, G. (2024). A Review of One-Box Electro-Hydraulic Braking System: Architecture, Control, and Application. Sustainability, 16(3), 1049. https://doi.org/10.3390/su16031049
- Martens, B., & Mueller-Langer, F. (2020). Access to digital car data and competition in aftermarket maintenance services. Journal of Competition Law & Economics, 16(1), 116-141. https://doi.org/10.1093/joclec/nhaa005
- Hey, F., & Zombek, M. (2026). Digital Control and Market Power in the Automotive Sector: OEMs, Gatekeeping, and the Future of Aftermarket Regulation. Journal of Industry, Competition and Trade, 26(1). https://doi.org/10.1007/s10842-026-00468-x
- Casper, R., & Sundin, E. (2020). Electrification in the automotive industry: effects in remanufacturing. Journal of Remanufacturing, 11(2), 121-136. https://doi.org/10.1007/s13243-020-00094-8
- Achetoui, Z., Mabrouki, C., & Mousrij, A. (2022). A balanced performance measurement system for automotive spare parts supply chain. Scientific Journal of Silesian University of Technology. Series Transport, 116, 25-55. https://doi.org/10.20858/sjsutst.2022.116.2
- United Nations Statistics Division. (2026). UN Comtrade Database: HS 870830 annual exports and US imports, 2015-2025 (public preview API, queried 2026-11-15). https://comtradeapi.un.org/public/v1/preview/C/A/HS